Analysis of Monday's Trades:
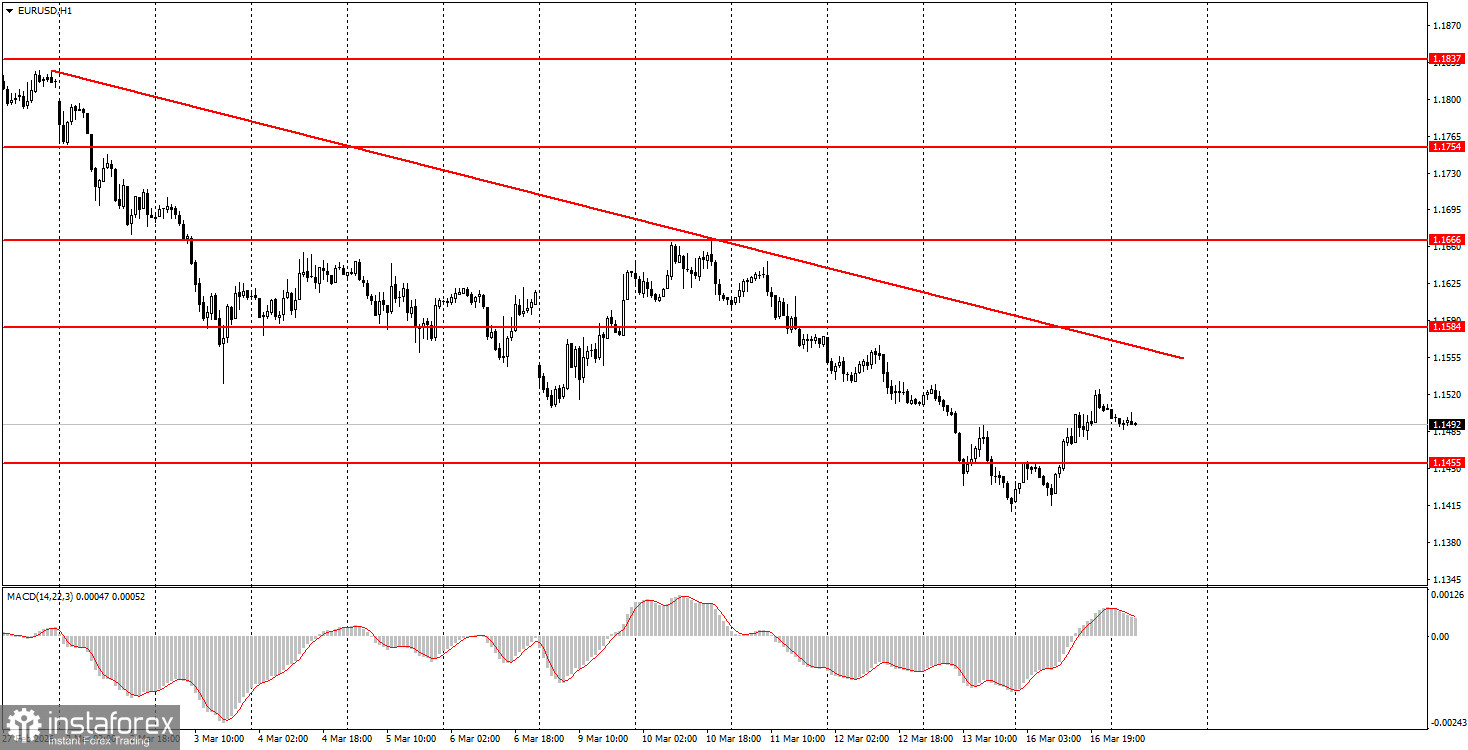
1H Chart of the EUR/USD Pair
The EUR/USD currency pair demonstrated a slight correction on Monday, which has had no significant impact so far. The downward trend persists, and the macroeconomic and fundamental backdrop remains unchanged (particularly in terms of traders' reactions). The geopolitical backdrop remains extremely positive for the dollar, yet it is unclear when the market will tire of focusing on the war in the Middle East. Perhaps the key geopolitical indicator right now is oil prices. The price of oil can indicate whether the situation in the Middle East is worsening or if the conflict is transitioning to a sluggish, formal exchange of fire between both sides. Over the past four days, Brent crude oil has risen by $3.50, which is quite substantial. However, we are no longer seeing rapid growth, and the situation with oil transportation from the Middle East is unlikely to worsen, as it is already completely blocked (except for routes to China). Thus, it can be assumed that the dollar is losing its only supporting factor. To be more confident in this assessment, an upward trend shift is required.
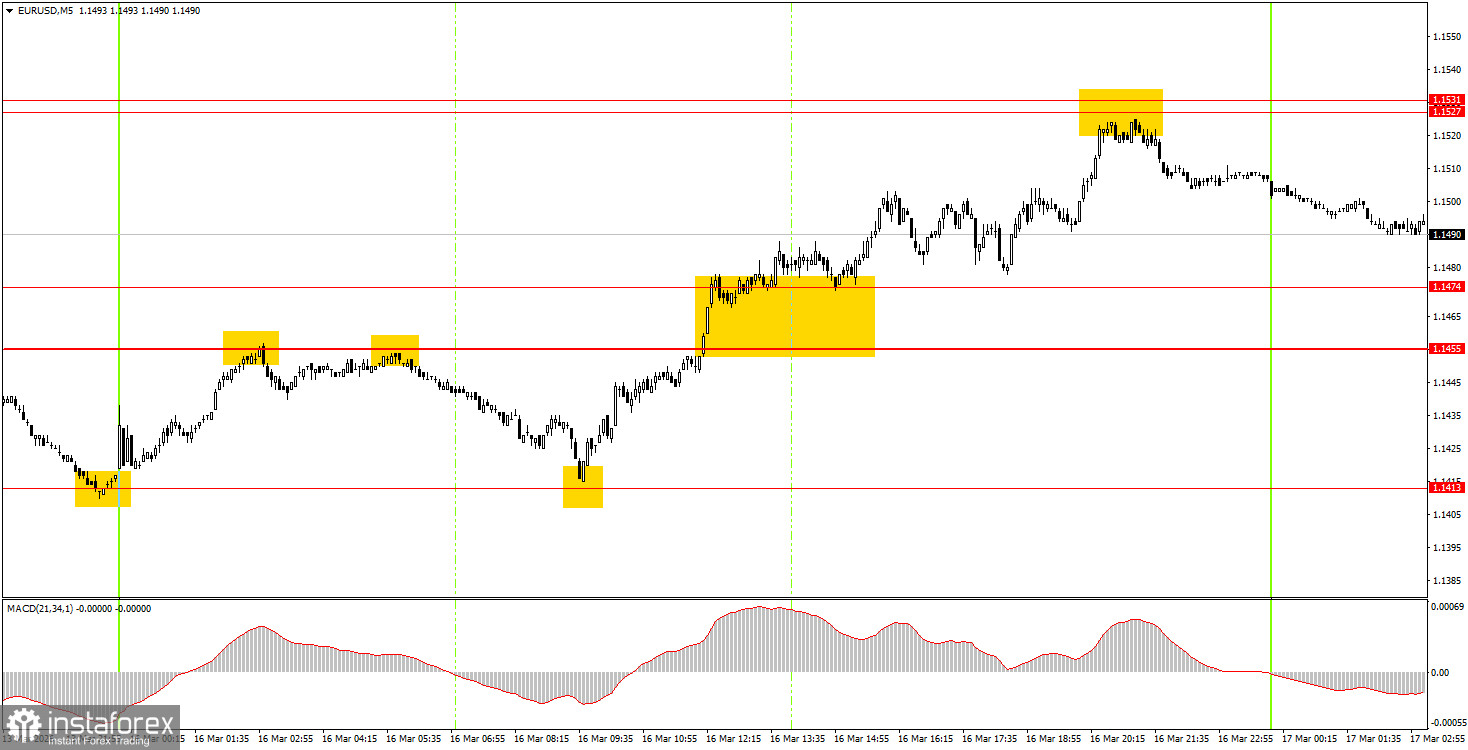
5M Chart of the EUR/USD Pair
On the 5-minute timeframe, several excellent trading signals were formed on Monday. In the morning, the price bounced off the 1.1455 level, then worked through the 1.1413 level over the course of a couple of hours. This was followed by a bounce from 1.1413, and the price rose to the area of 1.1527-1.1531 by the end of the day. A bounce from this area also served as another sell signal. Thus, beginner traders could have opened three trades yesterday, each of which was profitable.
How to Trade on Tuesday:
On the hourly timeframe, the downward trend is maintaining itself due to the war in the Middle East. At the beginning of 2026, a long-term upward trend resumed, so we expect renewed medium-term growth in the euro. The overall fundamental backdrop remains very complex for the American currency, as confirmed by reports on the labor market, GDP, and unemployment. However, at this time, the market's main focus is geopolitics, not economics.
On Tuesday, novice traders may consider new short positions if the price bounces from the area of 1.1527-1.1531 or consolidates below the area of 1.1455-1.1474. A price bounce from the area of 1.1455-1.1474 would allow for opening long positions with targets at 1.1527-1.1531 and 1.1584-1.1591.
On the 5-minute timeframe, levels to consider include 1.1267-1.1292, 1.1354-1.1363, 1.1413, 1.1455-1.1474, 1.1527-1.1531, 1.1584-1.1591, 1.1655-1.1666, 1.1745-1.1754, 1.1830-1.1837, and 1.1899-1.1908. The most interesting reports on Tuesday will be the ZEW Economic Sentiment Indexes for the Eurozone and Germany. These are purely secondary reports, and the likelihood of a market reaction to them is minimal.
Key Principles of the Trading System:
- The strength of a signal is determined by the time it takes to form the signal (bounce or breakout). The less time taken, the stronger the signal.
- If two or more trades have been opened at a particular level based on false signals, all subsequent signals from that level should be ignored.
- In a flat market, any pair can form many false signals or none at all. In any case, at the first signs of a flat trend, it is best to stop trading.
- Trading deals are to be opened during the period between the start of the European session and the mid-American session, after which all trades should be closed manually.
- On the hourly timeframe, it is preferable to trade based on signals from the MACD indicator only when there is good volatility and a trend confirmed by a trend line or trend channel.
- If two levels are positioned too close together (5-20 pips apart), they should be considered a support or resistance area.
- Upon moving 15 pips in the correct direction, a Stop Loss should be set to breakeven.
What to Look for on the Charts:
Price levels of support and resistance are levels that serve as targets when opening buys or sells. Take Profit levels can be placed around them.
Red lines represent channels or trend lines that show the current trend and indicate the direction in which it is preferable to trade now.
The MACD indicator (14,22,3) – the histogram and the signal line – is a supporting indicator that can also be used as a source of signals.
Important speeches and reports (always included in the news calendar) can significantly affect the movement of the currency pair. Therefore, during their release, trading should be done with utmost caution, or traders should exit the market to avoid sharp price reversals against the previous movement.
Beginning traders in the forex market should remember that not every trade can be profitable. Developing a clear strategy and effective money management are the keys to long-term trading success.