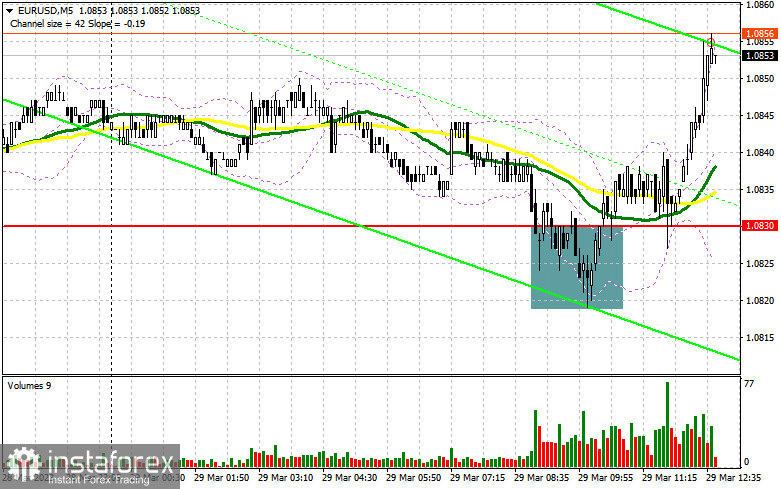
I focused on the 1.0830 level in my morning forecast and suggested making choices about entering the market from there. Let's take a look at the 5-minute chart to see what happened. The decline and false collapse at this level provided a buy indicator for the euro, which has already caused a 25-point increase. The technical situation and the strategy itself have not changed at all for the second half of the day.
If you want to trade long positions on EUR/USD, you will need:
The euro was able to grow with the possibility of reaching a new weekly maximum and then being tested against a comparable monthly mark due to the lack of data on the eurozone and the focus on the speeches of ECB representatives. Trading will continue to take place above 1.0830, so we can anticipate a further rise in the pair. I advise you to hold off on taking long positions until the 1.0830 range is updated in case of positive news about changes in the number of pending home sales in the United States and FOMC member Michael S. Barr's speech caused a negative response. By way of comparison with what I just talked about, you can purchase euros there after a false collapse. All of this will result in a rise toward the resistance level of 1.0874, which we missed in the morning. This level's breakout and top-down test provide an extra entry point for developing long positions with an increase to 1.0929 (the highest point this month at which I will fix profits) as the target. The pressure on the euro will grow if EUR/USD declines and there are no buyers at 1.0830 during the US session, which is also possible, and we will see a downward movement to 1.0791. The only indication to buy the euro will be the development of a false collapse there. In anticipation of a rebound from the low of 1.0751 or even lower, around 1.0716, I will initiate long positions right away with the intention of a 30- to 35-point upward correction during the day.
If you want to trade short positions on EUR/USD, you'll need:
Although sellers attempted to make an offer around 1.0830, it wasn't very successful. Most likely, they won't return to the market until reliable data about the United States is made public. The most crucial thing is to avoid missing 1.0874 because, at that point, a new positive trend will begin, ending the pair's downward correction. The formation of a false breakout at 1.0874, which results in a reduction in the area of intermediate support at 1.0830, which could not be broken below in the first half of the day, will be the ideal situation for initiating new short positions. This range will be broken, and a reverse test will result in a 1.0791 decline in the pair. Following a consolidation below this range following positive US economic data, the market will move more significantly toward the 1.0751 level and resume its negative trend. I'll set the profit there. I suggest delaying opening short positions until the level of 1.0929 if the EUR/USD moves higher during the American session and there are no bears at the current price of 1.074. This situation is also quite likely. In anticipation of a rebound from the high point of 1.0964, I will initiate short positions right away with a 30- to 35-point correction in mind.
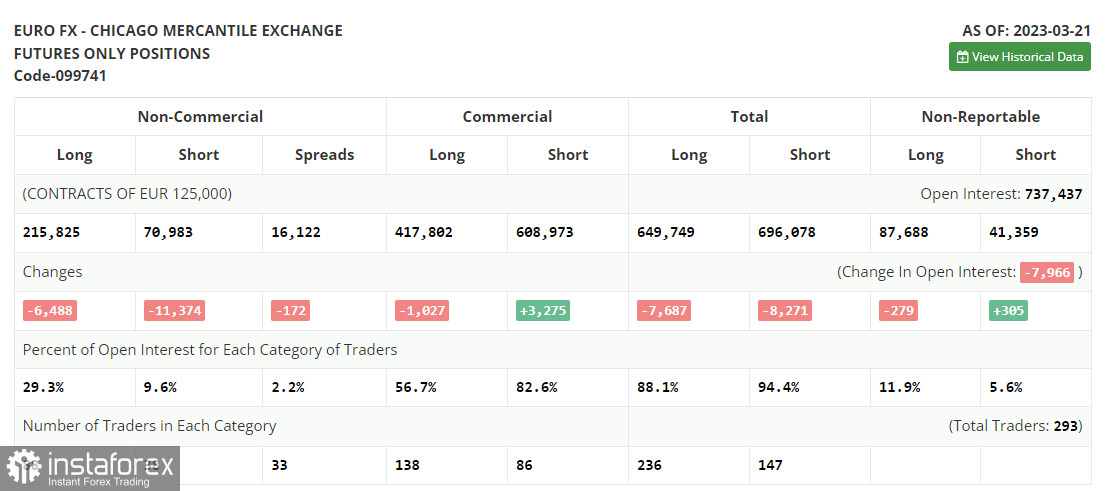
Both long and short positions decreased as of March 21, according to the COT report (Commitment of Traders). Market adjustments were made following the Federal Reserve System's meeting in March, but a significant decline in the value of the US dollar relative to the euro is unlikely given that the committee's objectives and policies have not altered. The aggressive European Central Bank, which constantly raises interest rates and has no plans to change course, is the only factor supporting the euro so far. According to the COT report, short non-commercial positions dropped by 11,374 to a level of 70,983, while long non-commercial positions decreased by 6,488 to a level of 215,825. The total non-commercial net position rose to 144,842 from 139,956 by the conclusion of the week. In comparison with 1.0803, the weekly closing price rose to 1.0821.
Signals from indicators
Moving Averages
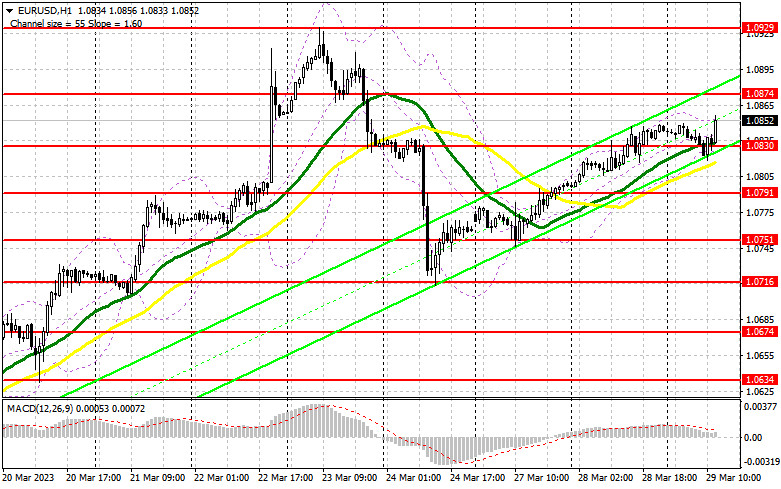
Trading is taking place above the 30- and 50-day moving averages, which shows that the euro is still rising.
Notably, the author considers the time and prices of moving averages on the hourly chart H1 and departs from the standard definition of the traditional daily moving averages on the daily chart D1.
Bands by Bollinger
The indicator's upper limit, which is located around 1.0830, will serve as resistance in the event of growth.
Description of indicators
- Moving average (moving average determines the current trend by smoothing out volatility and noise). Period 50. The graph is marked in yellow.
- Moving average (moving average determines the current trend by smoothing out volatility and noise). Period 30. The graph is marked in green.
- MACD indicator (Moving Average Convergence / Divergence - moving average convergence/divergence) Fast EMA period 12. Slow EMA period 26. SMA period 9
- Bollinger Bands (Bollinger Bands). Period 20
- Non-profit speculative traders, such as individual traders, hedge funds, and large institutions, use the futures market for speculative purposes and to meet certain requirements.
- Long non-commercial positions represent the total long open position of non-commercial traders.
- Short non-commercial positions represent the total short open position of non-commercial traders.
- Total non-commercial net position is the difference between the short and long positions of non-commercial traders.